This Tool Helps the Construction Companies See Their Cash Flow Ahead of Time
Concerns about cash flow is one of the biggest struggles construction companies and contractors face — and for good reason. These businesses typically lay out large amounts of money for project-related expenses. Waiting to get paid until the job is complete is a sure way for a company to go out of business.

This is especially hard on smaller companies with limited cash on hand when they are working on larger, long-term projects.
An alternative approach is for businesses to be paid when predefined stages or percentages of a project are complete, a model called “progress payments.”
Progress payments benefit all parties involved.
The Payment Application is an Excel spreadsheet that is used for tracking progress payments made on construction projects. A payment application is more than a simple invoice. It includes a schedule of values based on the proposal and the individual items included in the scope of work.
Construction companies aren’t banks and shouldn’t be carrying the cost of larger construction projects until they are finished. Progress payments help companies recover a portion of their costs for the project along the way, thereby maintaining a steady cash flow.
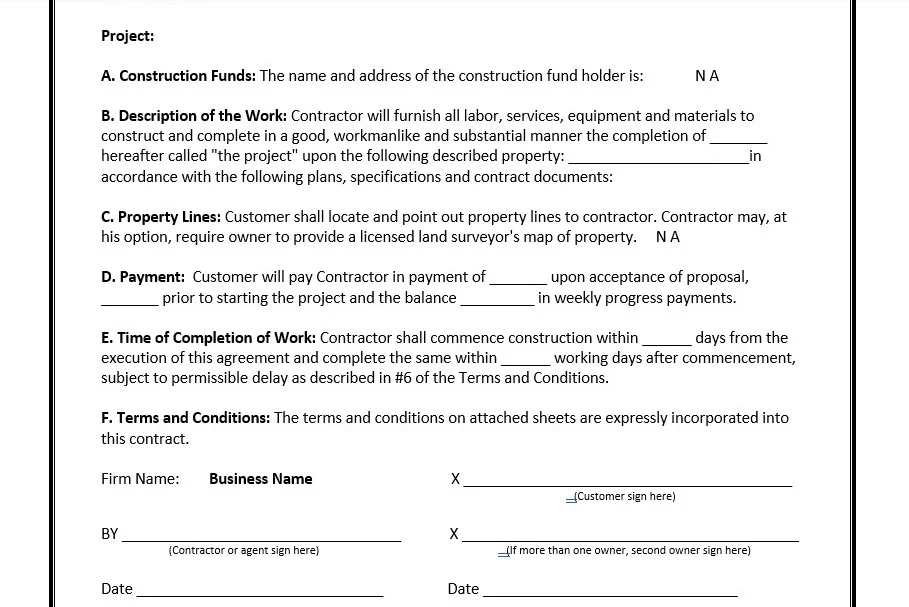
Payment applications can also protect companies in the case of client nonpayment throughout the construction process. At Timber Creek Construction we have a delay condition in our contract that we can stop working on a project if a progress payment is not received promptly.

In the construction industry, a progress payment is a partial payment often made after the completion of a predefined stage of work — for example, demolition, concrete, framing, roofing or siding. These installments replace single, lump-sum payments at the end of a project or a “half upfront, half at the end” arrangements.
Making payments connected to the completion of a specific stage of work can create some confusion., For instance, does completion of concrete include sidewalks and garage approaches that may not be able to be completed until other things are done? That’s why at Timber Creek Construction we choose to make our payments based on periods of time rather than stages. We then determine how much has been done within the predetermined period of time and invoice accordingly.
Benefits to progress payments are:
- Stable cash flow – Progress payments provide construction firms and contractors with a steady stream of income, thereby reducing the amount of working capital needed for projects. This makes it easier for companies to cover costs for supplies and labor throughout the project. This minimizes the need to go into debt.
- Increased motivation – Reaching that next milestone to get that next progress payment is a great motivator in the construction industry. Being paid along the way can also drive productivity, reduce material and labor expenses, and result in higher profits.
- Minimizing payment problems – Getting paid based on progress establishes a steady expectation of cash flow and when you should expect it. If payments begin coming in late, or not at all, it could be a sign that the client is having financial issues. Delayed payments help flag this early and can prevent the need to take legal action.
- Opportunity to pause the project – If a customer doesn’t pay their progress payment for work completed, you may decide to pause work until the issue is resolved.
The one drawback to progress payments is like most other business-related activities…it means more paperwork.

Construction companies and contractors need to make sure they are paid. Most don’t have a dedicated financial or accounting department to handle that function. This puts that task on the basic office staff or the contractor himself.
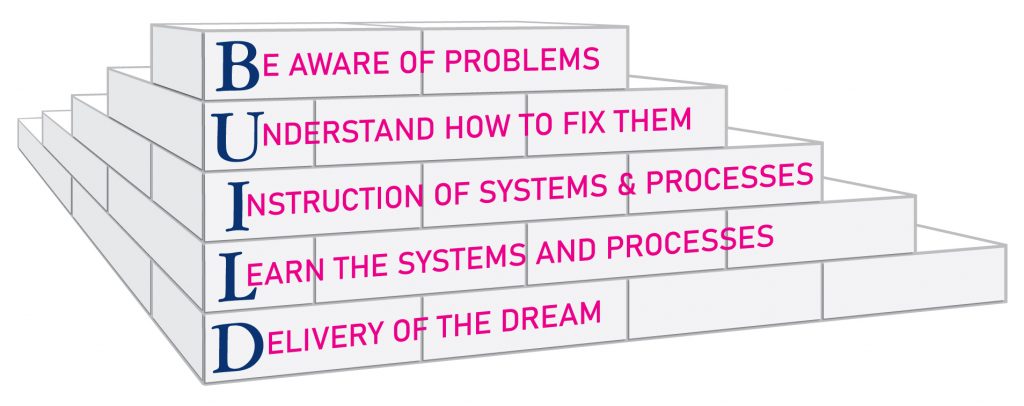
This is where having a Business BUILDing Tool and a system to use it comes in.
Next week we’ll look at the specifics of our Payment Application and how that tool works.


